19
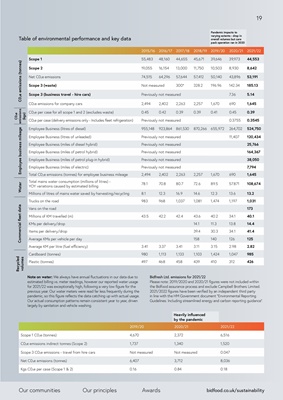
Note on water: We always have annual fluctuations in our data due to
estimated billing vs. meter readings, however our reported water usage
for 2021/22 was exceptionally high, following a very low figure for the
previous year. Our water meters were read far less frequently during the
pandemic, so this figure reflects the data catching up with actual usage.
Our actual consumption patterns remain consistent year to year, driven
largely by sanitation and vehicle washing.
Bidfresh Ltd. emissions for 2021/22
Please note: 2019/2020 and 2020/21 figures were not included within
the Bidfood assurance process and exclude Campbell Brothers Limited.
2021/2022 figures have been verified by an independent third party
in line with the HM Government document "Environmental Reporting
Guidelines: Including streamlined energy and carbon reporting guidance".
Heavily influenced
by the pandemic
2019/20 2020/21 2021/22
Scope 1 C02e (tonnes) 4,670 2,372 6,516
C02e emissions indirect tonnes (Scope 2) 1,737 1,340 1,520
Scope 3 C02e emissions - travel from hire cars Not measured Not measured 0.047
Net C02e emissions (tonnes) 6,407 3,712 8,036
Kgs C02e per case (Scope 1 & 2) 0.16 0.84 0.18
Table of environmental performance and key data
2015/16 2016/17 2017/18 2018/19 2019/20 2020/21 2021/22
Scope 1 55,483 48,160 44,655 45,671 39,646 39,973 44,553
Scope 2 19,055 16,154 13,000 11,750 10,503 8,930 8,642
Net C02e emissions 74,515 64,296 57,644 57,412 50,140 43,896 53,191
Scope 3 (waste) Not measured 300* 328.2 196.96 142.34 185.13
Scope 3 (business travel - hire cars) Previously not measured 7.36 5.14
C02e emissions for company cars 2,494 2,402 2,263 2,257 1,670 690 1,645
C02e per case for all scope 1 and 2 (excludes waste) 0.45 0.42 0.39 0.39 0.41 0.45 0.39
C02e per case (delivery emissions only - Includes fleet refrigeration) Previously not measured 0.3755 0.3545
Employee Business (litres of diesel) 955,148 923,864 861,530 870,266 655,972 264,702 524,750
Employee Business (litres of unleaded) Previously not measured 11,407 120,434
Employee Business (miles of diesel hybrid) Previously not measured 25,766
Employee Business (miles of petrol hybrid) Previously not measured 164,367
Employee Business (miles of petrol plug-in hybrid) Previously not measured 38,050
Employee Business (miles of electric) Previously not measured 7,794
Total C02e emissions (tonnes) for employee business mileage 2,494 2,402 2,263 2,257 1,670 690 1,645
Total mains water consumption (millions of litres) -
YOY variations caused by estimated billing
78.1 70.8 80.7 72.6 89.5 57.871 108,674
Millions of litres of mains water saved by harvesting/recycling 8.1 12.3 16.9 14.6 12.3 13.6 13.2
Trucks on the road 983 968 1,037 1,081 1,474 1,197 1,031
Vans on the road 173
Millions of KM travelled (m) 43.5 42.2 42.4 43.6 40.2 34.1 40.1
KMs per delivery/drop 14.1 11.3 13.8 14.4
Items per delivery/drop 39.4 30.3 34.1 41.4
Average KMs per vehicle per day 158 140 126 125
Average KM per litre (fuel efficiency) 3.41 3.37 3.41 3.11 3.15 2.98 2.82
Cardboard (tonnes) 980 1,113 1,133 1,103 1,424 1,047
Pending
from Mark
Harrison
Plastic (tonnes) 497 468 458 439 410 312
Pending
from Mark
Harrison
C02e emissions (tonnes)
C02e
emissions
(kgs)
Employee business mileage
Water
Commercial fleet data
Recycled
volumes
bidfood.co.uk/sustainability
Our principles
Our communities Awards
19
Pandemic impacts to
varying extents - drop in
overall volumes but care
pack operation ran in 2020